
Most creators obsess over a metric that does not exist in the real world, and checking your actual reach using a reliable instagram engagement rate calculator is the only way to audit your organic growth velocity.
Follower-based engagement is a vanity metric. True attention is measured by dividing total interactions by unique reach, where a healthy 2026 rate is 8% to 15% for micro-creators. To scale, audit reach-based metrics weekly and remove ghost accounts to maintain test-group responsiveness.
They log onto their dashboard, look at their follower count, and feel a brief wave of validation. Then they look at their reach and realize their content is dying in silence.
This is the vanity loop. It is an artificial high designed to keep you posting while your business attention decays.
Your follower count is a historical record, not active attention.
If you have fifty thousand followers but only fifty people see your content, your follower count is not an asset. It is a ledger of dead weight.
The algorithm does not care about your past milestones: it cares about active, compounding velocity. If your audience does not respond to your signals, the feed treats your account like a ghost town.
To scale in 2026, you must stop measuring vanity and start measuring leverage. You must audit your numbers on clean, deterministic math.
This is the systematic guide to auditing your true performance using an objective engagement rate calculator framework.
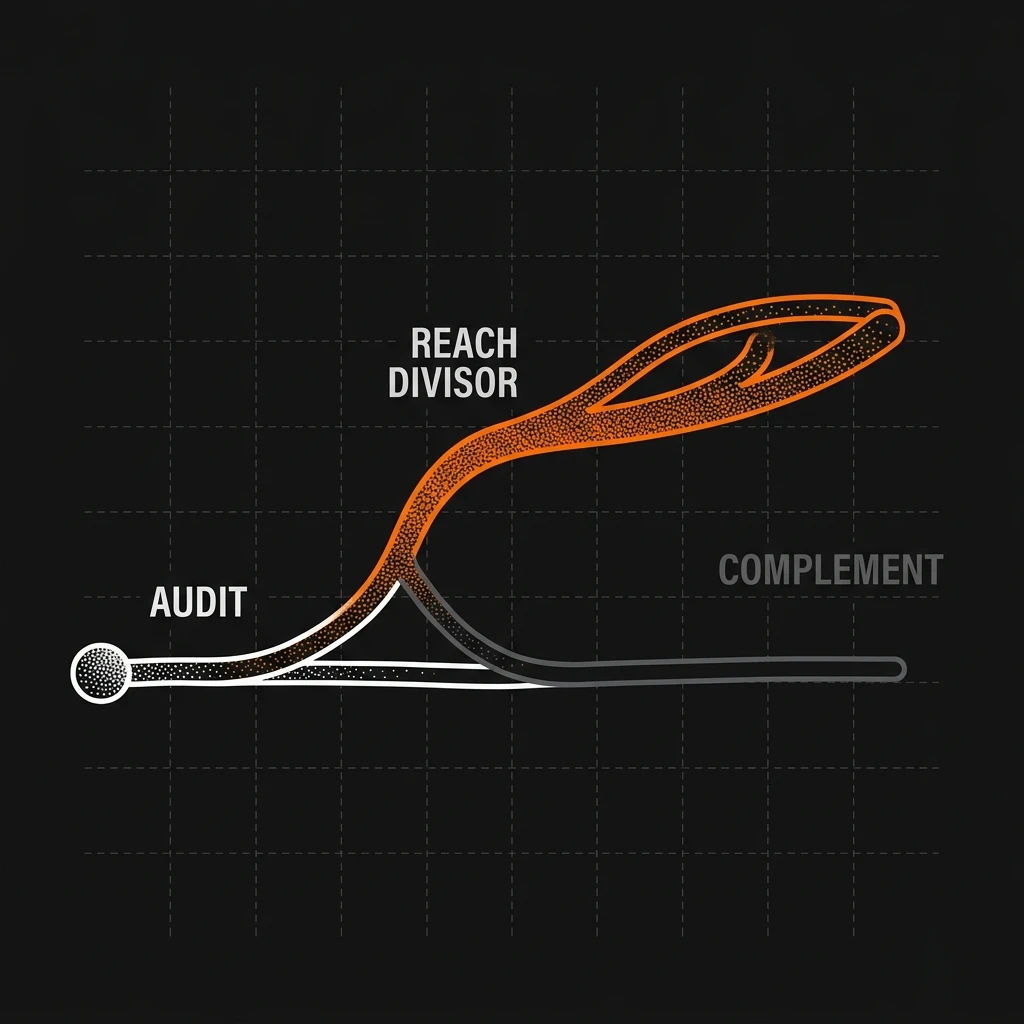
Deep Dive: The Illusion of Public Attention
Many struggling brands look at major pages and assume they need to match their high follower counts to drive sales.
They see an account with one hundred thousand followers and attempt to buy or manufacture followers through giveaways. They corrupt their audience taxonomy, fill their list with ghost accounts, and watch their organic reach plunge to zero.
They do not understand that the algorithm evaluates the ratio of active engagement to overall reach. Raw followers diluting active engagement is a fast path to account suppression.
Clarity and authentic interaction beat raw volume every single day. Let the math guide you.
1. How Do You Calculate Your Instagram Engagement Rate?
Before you calculate your score, you must understand the different mathematical approaches. Most basic software uses follower count as the divisor because it is easy to scrape. This is a massive mistake that distorts your strategic view.
Followers represent historical interest, whereas reach represents active attention. In 2026, audience attention is highly fragmented, and a follower list contains significant bot decay.
To analyze content performance accurately, we must separate follower-based calculations from reach-based calculations. The reach-based engagement rate calculator is the only metric that measures the quality of your message in front of a live audience.
If you rely strictly on follower-based math, you will misdiagnose your successes. A post that goes viral on the explore page will show a low follower-based engagement rate because it reaches non-followers. A reach-based calculation will show it was a massive success, giving you clean data to iterate on.
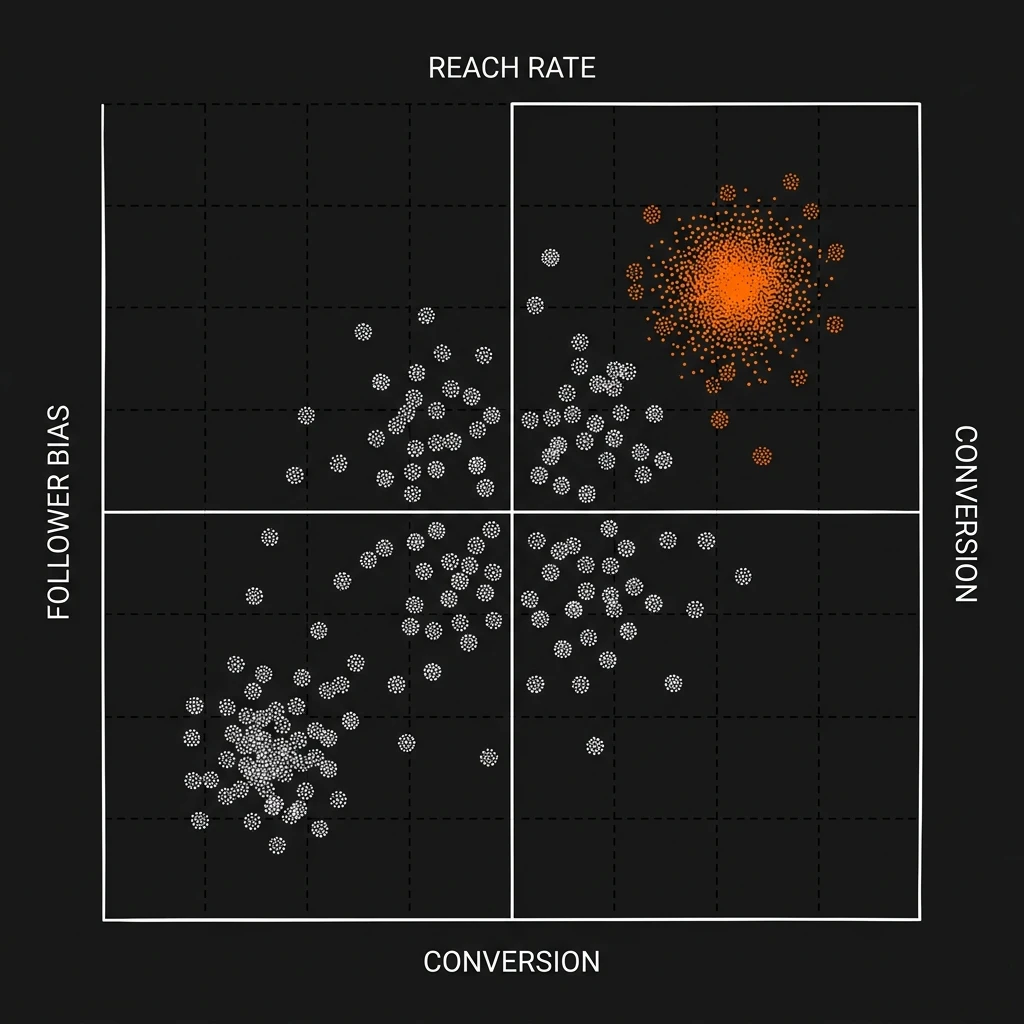
Deep Dive: The Division Paradigm
Traditional engagement rates dilute your active metrics by dividing by accounts that have not seen your content in years.
When you shift the divisor to reach, you isolate the exact quality of your content. You see whether people who actually viewed your post decided to engage with it.
This is the transition from broad guesswork to granular optimization. If your reach-based rate is high, your hook is solid and your copy is engaging, even if your total follower count is low.
A clean divisor yields a clean strategy. Avoid bloated metrics.
2. What Is a Good Instagram Engagement Rate in 2026?
You cannot judge your numbers in a vacuum. A three percent engagement rate is outstanding for a brand with two million followers, but it represents stagnation for a creator with five thousand followers. You must benchmark within your specific tier.
As accounts grow, their engagement rate naturally decreases. This is not a penalty: it is a mathematical certainty. Broad audiences are less cohesive than small, highly specialized communities.
The table below outlines the realistic, verified engagement benchmarks across major follower tiers in 2026.
"Stop comparing your micro-conversion metrics to accounts that exist in a completely different tier. Niche specificity and clean data structures are your true competitive advantage."
If you are a Micro-Creator and your reach-based engagement is below eight percent, your content is failing to resonate. It means your audience is scrolling past without reading, viewing, or saving. You must systematically audit your distribution loop.
3. Why Is Your Instagram Engagement Rate Dropping Silently?
The silent killer of Instagram growth is audience decay. Over time, accounts become inactive, users abandon profiles, and automated bots follow your page. These dead profiles stack up on your follower list.
When you publish a post, the algorithm distributes it to a small test group of your followers. If that test group is filled with ghost accounts, they will not engage because they are not active. The algorithm reads this lack of interaction as a signal that your post is low quality, and stops distributing it entirely.
This is the decay loop. Your overall reach collapses because your follower list is bloated with dead weight.
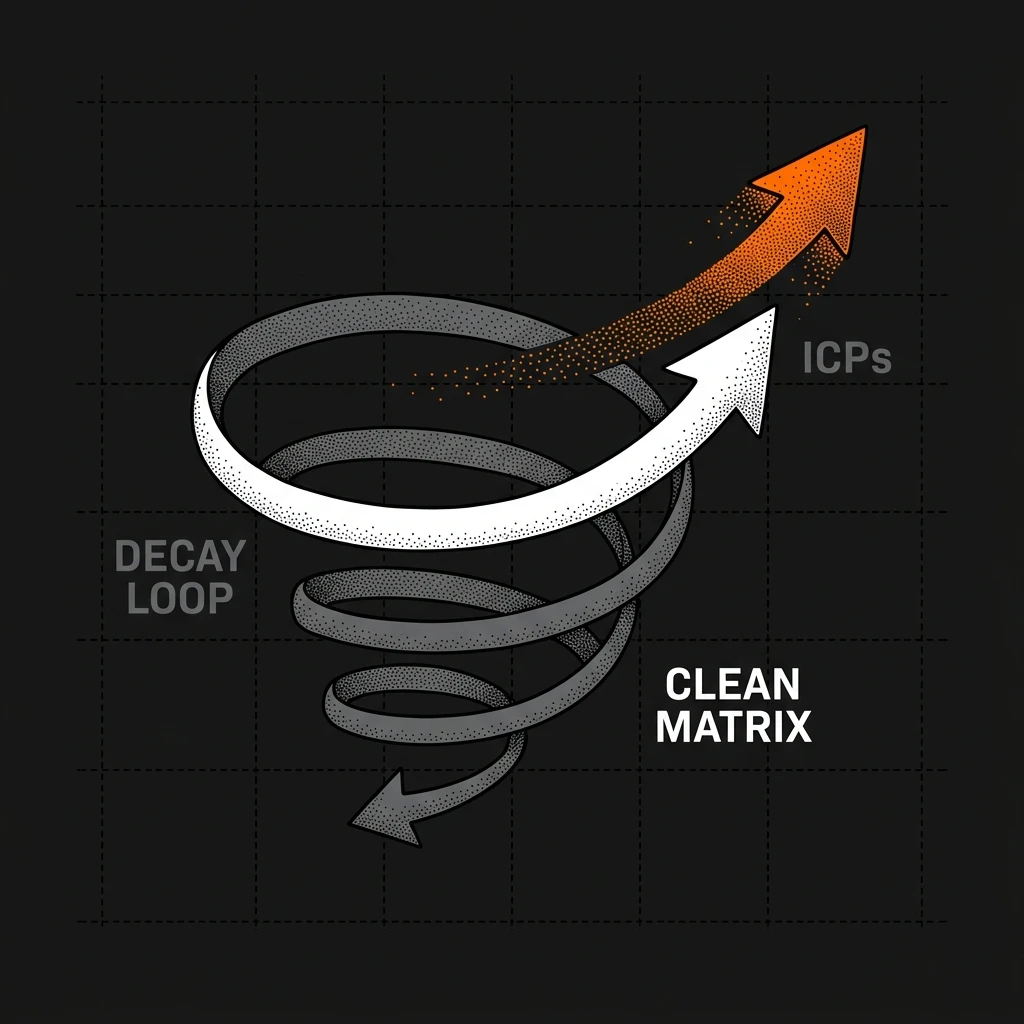
Deep Dive: Overcoming Audience Bloat
Audience bloat occurs when a page acquires thousands of inactive followers, causing a severe drop in the test-group engagement ratio.
To break this cycle, you must clean your follower database. Identifying and removing inactive accounts instantly improves your initial test ratios.
This tells the content suggestor that your active audience is highly responsive, accelerating your organic reach to new explore circles.
Clean your follower baseline. High-density attention always wins.
You do not need to manually block ten thousand profiles to fix this issue. You simply need to audit your active ratios weekly and adjust your hook strategies to capture immediate attention, overriding the dead weight of inactive followers.
4. How Do You Audit Your Instagram Engagement Rate in 4 Steps?
To build a high-performance content engine, you must establish a consistent, data-driven audit loop. Stop relying on high-level averages: track your specific metrics weekly. Follow this systematic process to calculate and optimize your real scores.
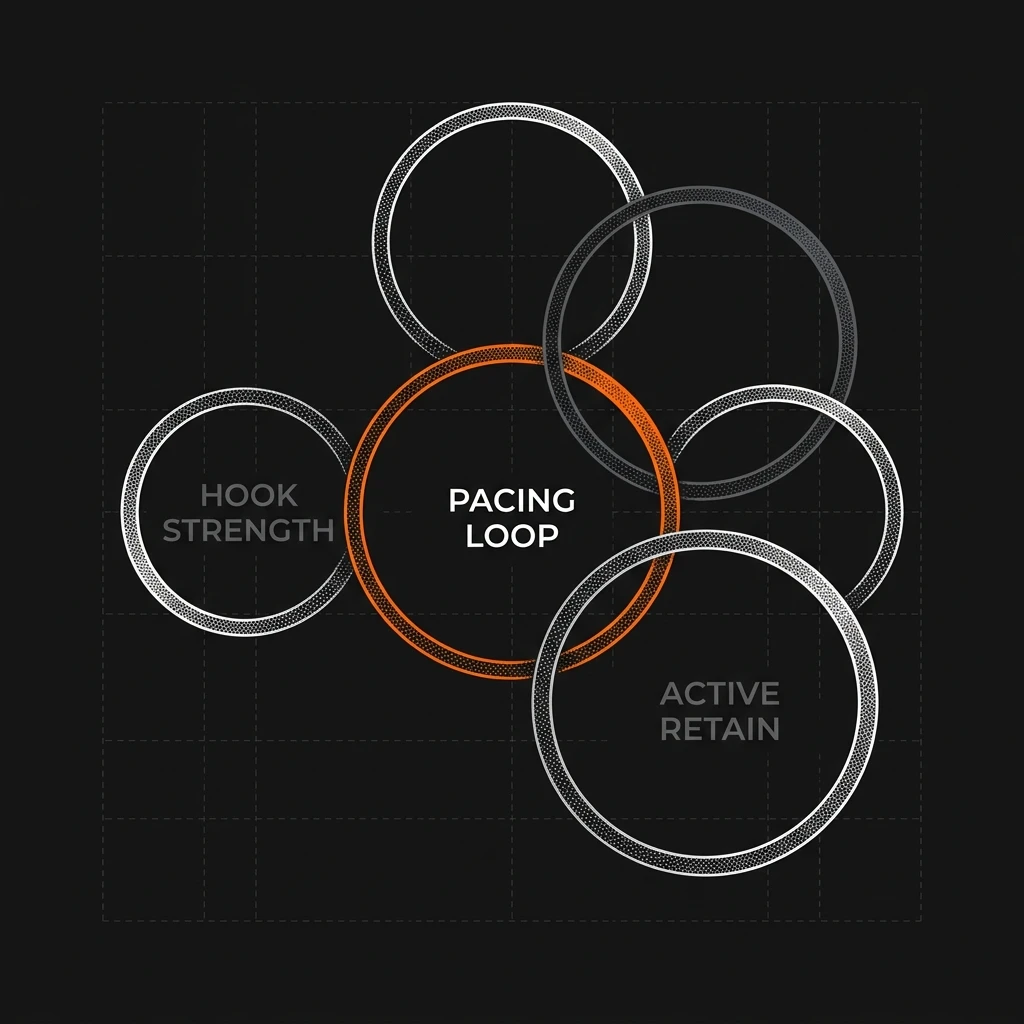
Deep Dive: The Visual Pacing Loop
When you repeat this audit process weekly, you begin to see patterns. You identify the specific hooks that drive saves and shares, allowing you to stop producing content that gets ignored.
Growth is a game of consistent iteration based on clean data, not lucky spikes.
Isolate your top-performing creative hooks and execute with precision.
5. How Do You Increase Your Instagram Engagement Rate via the Algorithm?
To maximize the efficiency of your content distribution, you must align your posting strategy with key organic multiplier signals. The explore graph prioritizes velocity of interaction over volume of views. When you publish an asset, the system tracks the speed at which saves and shares accumulate in the first forty-five minutes.
If this acceleration velocity is high, the algorithm elevates your content to primary explore placements. To optimize this initial window, coordinate your email newsletters and community channels to drive immediate high-intent traffic to your profile page as soon as your content goes live.
Furthermore, ensure you audit these performance indicators systematically. Do not rely on native in-app reports that group all traffic types together.
Use a professional instagram engagement rate calculator workflow to separate your organic exploration reach from your existing subscriber feed impressions. This isolation is crucial to verify if your creative assets are actually acquiring new warm prospects or simply saturating your warm audience.
If this acceleration velocity is high, the algorithm elevates your content to primary explore placements. To optimize this initial window, coordinate your email newsletters and community channels to drive immediate high-intent traffic to your profile page as soon as your content goes live.
Furthermore, ensure you audit these performance indicators systematically. Do not rely on native in-app reports that group all traffic types together.
Use a professional instagram engagement rate calculator workflow to separate your organic exploration reach from your existing subscriber feed impressions. This isolation is crucial to verify if your creative assets are actually acquiring new warm prospects or simply saturating your warm audience.
Your content dictates your growth, but your math dictates your survival.
Stop chasing the validation of raw follower numbers. Stop posting blindly without checking your active retention numbers.
Clean your metrics, calculate your true reach-based engagement rate, and build a systematic distribution model based on clean data.
References & Authoritative Sources
- Meltwater Influencer Integrity Audit Data (2026): Statistical analysis of engagement inflation and automated comment pods across global creator campaigns.
- AnalyzeInsta Guide on Ghost Followers: Systematic framework for diagnosing and clearing dead weight followers to recover organic reach.
- AnalyzeInsta Reel Analytics Blueprint: Quantitative breakdown of interaction velocity and algorithmic weight distribution.
- AnalyzeInsta Reach vs. Impressions Study: Understanding frequency metrics and unique audience expansion graphs.
Written by Julian Vivaan. CEO, AnalyzeInsta.